Series: The daily checks that keep a healthcare platform running
The command
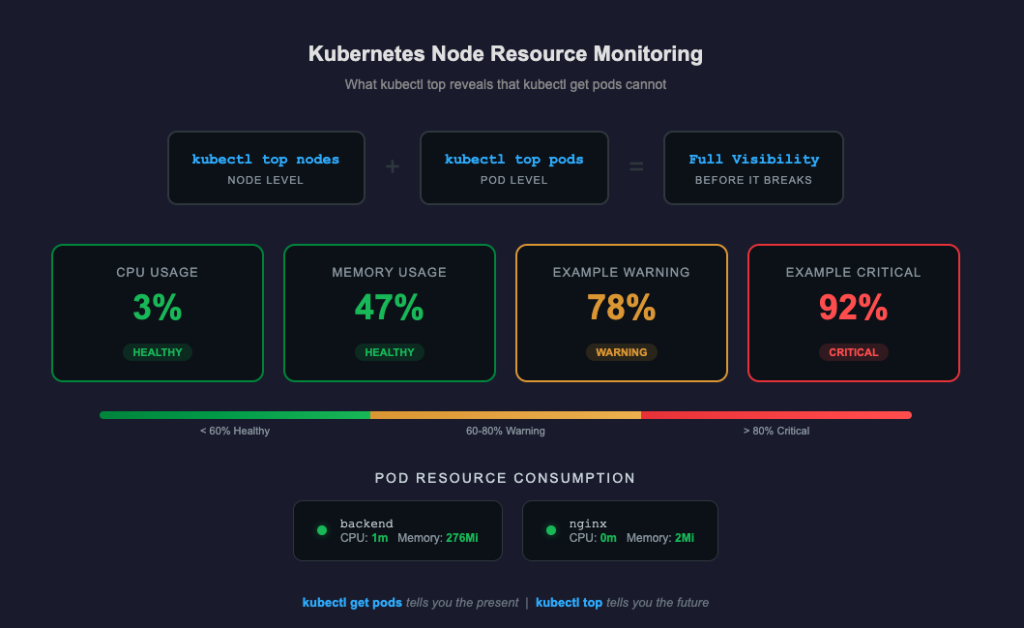
kubectl top nodes
kubectl top pods
Two commands. Ten seconds. And yet, most teams skip them until something breaks.
Why this check exists
There’s a dangerous gap between “running” and “healthy.”
Your first daily check — kubectl get pods — tells you whether your pods are alive. This second check tells you whether they’re struggling.
A pod can report Running and still be:
- Consuming 95% of its allocated memory
- CPU-throttled to the point where API responses take 5 seconds
- One incoming request away from being OOMKilled by Kubernetes
None of that shows up in pod status. It only shows up here.
What these commands tell you
kubectl top nodes shows the resource consumption of your cluster’s machines — the actual compute infrastructure your applications run on.
NAME              CPU(cores)   CPU(%)   MEMORY(bytes)   MEMORY(%)
node-xxxxx 72m 3% 1567Mi 47%- CPU(cores): How much processing power is being used. Measured in millicores — 1000m equals one full CPU core.
- CPU(%): That usage as a percentage of the node’s total capacity.
- MEMORY(bytes): How much RAM is currently consumed.
- MEMORY(%): That usage as a percentage of total available memory.
kubectl top pods -> breaks that down to the application level — which pods are consuming what.
NAME               CPU(cores)   MEMORY(bytes)
  backend            1m           276Mi
  nginx              0m           2Mi
This is where you spot the problem. Your node might look fine overall, but one pod could be consuming a disproportionate amount of resources.
Real example from production
Here’s what a healthy check looks like on our healthcare platform:
Node:  CPU 3%  |  Memory 47%

  Pod                CPU       Memory
  backend            1m        276Mi
  nginx              0m        2Mi
Low CPU. Memory well under threshold. Backend is doing its job without breaking a sweat. Nginx is just proxying —
barely registering.
This is what I want to see every morning. Not because these numbers are impressive, but because they’re stable. The
value of this check isn’t in the good mornings. It’s in the one morning where the numbers look different.
What bad looks like
Here’s what should trigger immediate investigation:
Memory creeping up over days
Day 1:  backend  276Mi
  Day 3:  backend  410Mi
  Day 5:  backend  580Mi
  Day 7:  backend  OOMKilled
This is a memory leak. The pod isn’t crashing — it’s slowly filling up. Kubernetes will eventually kill it when it exceeds its memory limit. It restarts, the leak begins again, and your users experience periodic disconnections that nobody can explain because the logs just show a clean restart.
CPU throttling
Pod                CPU       Memory
  backend            490m      276Mi
If your pod’s CPU request is 500m, this pod is about to be throttled. The application will still “work,” but every operation takes longer. API responses slow from 100ms to 2-3 seconds. Database queries queue up. The cascading effect is invisible until your users start complaining.
Node pressure
NAME              CPU(cores)   CPU(%)   MEMORY(bytes)   MEMORY(%)
  node-xxxxx        1800m        92%      2800Mi          85%
Your node is running hot. Any spike — a batch job, a traffic surge, a background process — could push it over. At this point, Kubernetes may start evicting pods to protect the node. It will choose which pods to kill based on priority classes and resource requests. If you haven’t configured those carefully, it might kill the wrong one.
The thresholds I watch
| Metric | Healthy | Warning | Critical |
|---|---|---|---|
| Node CPU | < 60% | 60-80% | > 80% |
| Node Memory | < 70% | 70-85% | > 85% |
| Pod Memory | Stable day-to-day | Growing trend | Approaching limit |
| Pod CPU | Well below request | Near request | At or above request |
These aren’t universal rules. They’re calibrated to our platform’s traffic patterns and resource allocation. Your thresholds should reflect your reality — but you need to be checking to know what your reality is.
What happens when you skip this check
I’ll be direct about the business impact, because in healthcare, infrastructure isn’t abstract.
Scenario 1: The silent memory leak
Your backend pod leaks 50Mi per day. Nobody checks kubectl top. On day six, it hits its memory limit during morning appointments. Kubernetes kills it. It restarts in 30 seconds. During those 30 seconds, three patients get connection errors during their consultations. One of them was mid-prescription. The doctor has to start over. The patient loses trust in the platform.
Scenario 2: CPU saturation during peak hours
Your node runs at 75% CPU — “fine” by most standards. At 9am, 15 doctors start consultations simultaneously. CPU spikes to 98%. API response times jump. Video calls buffer. The platform doesn’t crash, but every doctor’s experience degrades. Nobody files a bug report. They just start thinking “this platform is slow.” That perception is harder to fix than any bug.
Scenario 3: Scaling without visibility
You add a second backend replica to handle more traffic. But you don’t check node resources. Both replicas now
compete for memory on the same node. Instead of one healthy pod, you have two starving pods. Performance gets worse, not better. Without kubectl top, you’d think scaling was the right move. With it, you’d know you need
a bigger node first.
Prerequisites: Installing metrics-server
If you run kubectl top nodes and get:
error: Metrics API not availableYou need to install metrics-server. It’s the component that collects resource metrics from the kubelet on each node and makes them available through the Kubernetes API.
kubectl apply -f
  https://github.com/kubernetes-sigs/metrics-server/releases/latest/download/components.yaml
On EKS, you may also need:
kubectl patch deployment metrics-server -n kube-system \
    --type='json' \
    -p='[{"op": "add", "path": "/spec/template/spec/containers/0/args/-", "value":
  "--kubelet-insecure-tls"}]'
Wait 60 seconds, then verify:
kubectl top nodesThis is a one-time setup. Once installed, metrics-server runs continuously in the kube-system namespace.
Beyond manual checks: What to automate
As your platform matures, consider:
- Prometheus + Grafana for historical metrics and dashboards —
kubectl toponly shows current state, not trends - Horizontal Pod Autoscaler (HPA) to automatically scale pods based on CPU/memory thresholds
- Alerts on resource thresholds so you’re notified before a problem becomes an incident
- Resource requests and limits properly configured on every pod — without these, Kubernetes can’t make intelligent scheduling decisions
But none of that replaces the habit of checking. Dashboards go stale. Alerts get muted. The engineer who checks every morning catches the thing that automation missed.
The bottom line
kubectl get pods tells you the present — is it running or not.
kubectl top tells you the future — is it about to fail or not.
In production, especially in healthcare, you always want to see what’s coming. Two commands. Ten seconds. Every
morning. That’s the discipline that keeps a platform stable.
Comments are closed